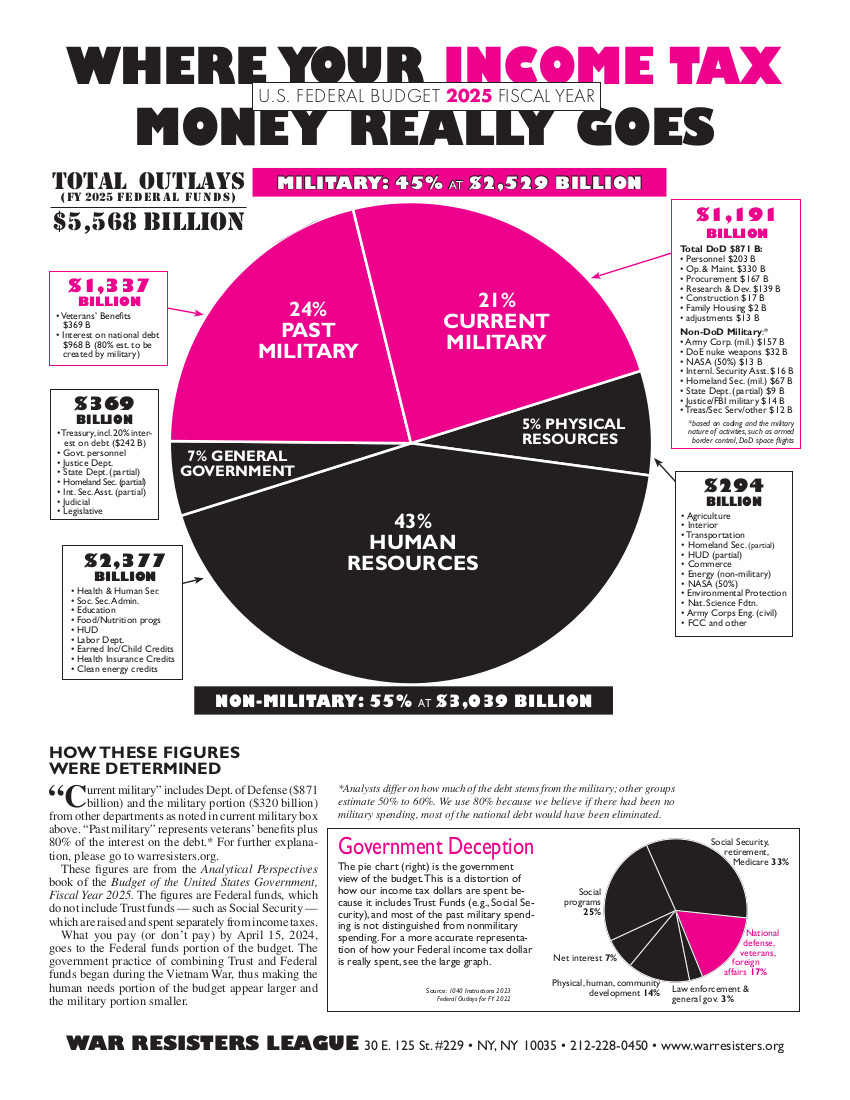
The government says 24% is going to the military. Why are your numbers different?
The front of the pie chart explains this with the comparison to the government’s pie chart. WRL analyzes the federal funds portion of the budget and excludes trust fund like Social Security. Those monies are raised and spent separately. The WRL pie chart focuses on federal income taxes, which pay into the general fund (see below). For example, a pay stub shows “federal income tax withheld” and “FICA.” We are analyzing the federal income tax. FICA is social security withholding.
Why do percentages vary among peace-oriented groups that analyze the budget?
WRL works side-by-side with other groups that do budget analysis, including the Friends Committee on National Legislation and National Priorities Project. We use similar methods to analyze the federal budget, but our numbers usually are not exactly the same. What follows are some of the reasons why.
Debt. In analyzing the federal debt WRL has used 80% of the debt as paying for past wars. Other groups choose a lower percentage. For a graphic presentation of why WRL chooses the higher number, see the fourth chart on Dave Johnson’s “Dear Deficit Commission” page of Campaign for America’s Future website. In addition, WRL has more detailed explanation in its book War Tax Resistance.
Military function in other agencies. Another example: WRL has also chosen to dissect the budget for Homeland Security (“defense” by another name) and include a percentage of that budget in military even though the budget coding may not be tagged as military. Transportation security, militarized border activities, much of the space program (we use 50%), and 100% of Coast Guard budget are categories we include in military. These details are listed next to each slice of the pie.
Time period analyzed. We use the president’s proposed budget for the next fiscal year whereas some groups use the most recent completed year.
Budget authority vs. outlays vs. discretionary spending. Some groups use budget authority figures or discretionary spending, whereas WRL uses outlays (see questions below).
Why include veterans benefits with war spending? Don’t they deserve benefits?
Some groups list veterans benefits as a separate category, more like a human services expense. We don’t disagree that veterans deserve benefits (everyone in need deserves benefits), but veterans benefits are a direct cost of wars—a cost that will be growing in the coming years. So we include it in the red, past wars slice of the pie.
I saw a chart that has a higher percentage of military spending than the WRL chart.
It’s important to compare the notes on each analysis and look for the source of the figures. The two major differences:
1) Analysis based on discretionary spending, which includes only budget items that Congress is allowed to tinker with. Discretionary spending does not reflect the total budget, because it excludes so-called “mandatory” spending items (such as interest on the national debt and retirement pay). WRL’s analysis is based on the total federal funds budget.
2) Outlays vs. Budget Authority. WRL uses “outlays” rather than “budget authority.” Outlays refer to spending done in a particular fiscal year, whereas budget authority refers to new spending authorized over a period of several future years. In researching “where your income taxes really go,” WRL is trying to show how much of the federal income tax you pay (or don’t pay) on April 15 is going to the military.
How often does WRL produce a pie chart?
Each year the president releases a proposed budget for the coming fiscal year, usually around the end of January or early February. WRL bases the pie chart on the figures in the published budget book, Analytical Perspectives. The federal government’s fiscal year begins October 1, and Congress has the months until then to argue over the proposed budget and agree on a final budget. The proposed budget is dated for the year ahead, and part of our motive is to give activists time to contact their elected officials during the period when the budget is being discussed and before it is finalized.
Does the fiscal year matter?
If you are comparing different analyses, the fiscal year is important. One might show proposed spending and another might be based on what was actually spent in a previous fiscal year. The military spending portion does not vary widely from year to year, and in rounding off WRL finds the average is about half of tax dollars go to the military.
Your numbers don’t match what the media announces as Pentagon spending when the president announces the budget.
The media usually uses the numbers for “budget authority” rather than “outlays” (see above) and tends to add up the budget for the Department of Defense and maybe the nuclear weapons portion of the Department of Energy. As noted above, there is military spending in other parts of the budget. WRL categorizes military spending by function codes throughout the budget, and we note the areas, like Homeland Security, that act like “Defense” by another name.
Do you analyze the budget after it is finalized or after the money is spent?
WRL analyzes the proposed budget and produces the pie chart in time for the April 15 tax day actions each year. A presidential transition can cause a delay in the budget process, and sometimes we have to use figures from past years. Actual spending from previous years usually appears in the charts that are published when the proposed budget is released. We generally do not do analysis of past budgets, although the Friends Committee on National Legislation usually uses the figures for the previous year.
I heard that the government just borrows for all its spending and that anything we pay goes to cover the debt.
National Priorities Project has an analysis of federal revenue for 2009 that shows 34% comes from individual income taxes, 57% from borrowing, and the other 9% from corporate, excise and miscellaneous taxes. Income tax dollars pay into the general fund to pay for the government activities shown in the full pie chart. The amount borrowed varies year-to-year, and income taxes, as part of general spending, would apply to interest on the debt as well as other government functions.
Read "Expenses of Past Wars", excerpted from War Tax Resistance: A Guide to Witholding Your Support from the Military