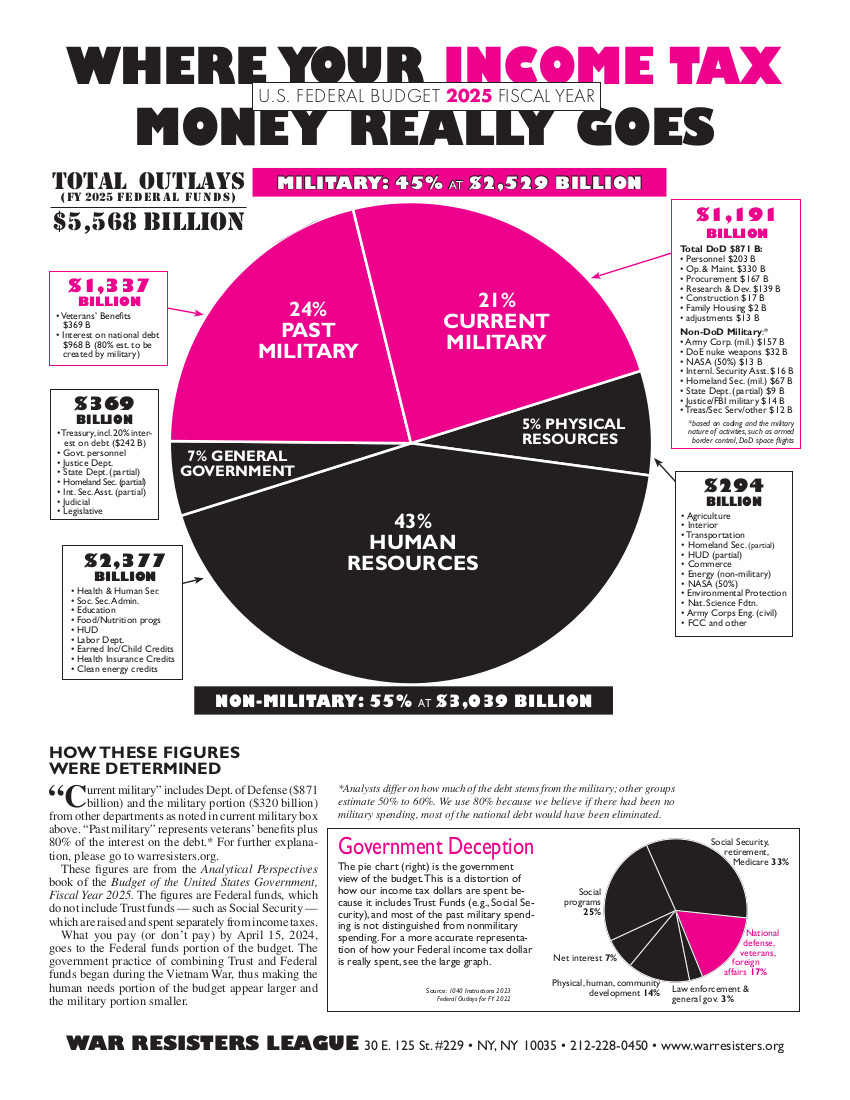
Today, March 14, is Pi Day (3.14), which brings to mind WRL’s annual pie chart. With millions of copies distributed, it is the most disseminated piece of literature in WRL’s history, reaching far beyond its membership to emphasize — obvious to many* beyond peace circles — that it’s military spending and war that bloats federal taxes, not welfare, not the social safety net, not illegal immigration, not abortion, not PBS, etc.
Beginning with the first pie chart flyer in 1984, presidents — from Reagan to Biden — have sent an annual budget proposal to Congress. Each year Ruth Benn and I analyze those figures for the “Where Your Income Tax Money Really Goes” flyer to show the percentage of an individual taxpayer’s federal tax dollars spent on war and the military. During those 40 years, the military percentage has varied between the high-30s to the mid-60s.
 Ruth Benn leafleting with the pie chart on Tax Day in front of the Manhattan IRS in 2015 (photo by Ed Hedemann)
The founding purpose of the pie chart was to give people an idea of what portion of their federal income taxes contributes to military spending and, if they choose, how much to refuse to send to the IRS, or at least include a letter objecting to having to pay that amount. Of course, in practice, different war tax resisters refuse different amounts ranging from a small symbolic amount to everything, reasoning that anything they send will be spent in part on the military and U.S. wars.
However, percentages can be deceptive since it’s the absolute dollar amounts that really counts. For example, the FY1985 budget proposal called for $431 billion in military spending or 64%, while the FY2024 budget called for $2,297 billion or 37%. This may seem counterintuitive but it’s just an indicator that overall social and other non-military spending — especially during the pandemic — increased sharply, thus shifting percentages, though the dollar amount of military spending virtually always increases.

Numbers aside, the pie chart has proven to be an effective propaganda tool, bringing WRL’s name and politics to people and constituencies well beyond the immediate membership. Around tax day (generally in mid-April) the pie chart is distributed in hundreds of communities in front of IRS offices, post offices, government buildings, military installations all across the United States. Lots of people mail it to their members of Congress and the president.
Café Pentagon performs a skit as waiters with WRL’s pie chart offer trays of weapons to Easter Parade revelers on NYC’s Fifth Avenue, April 15, 2001 (photo by Ed Hedemann)
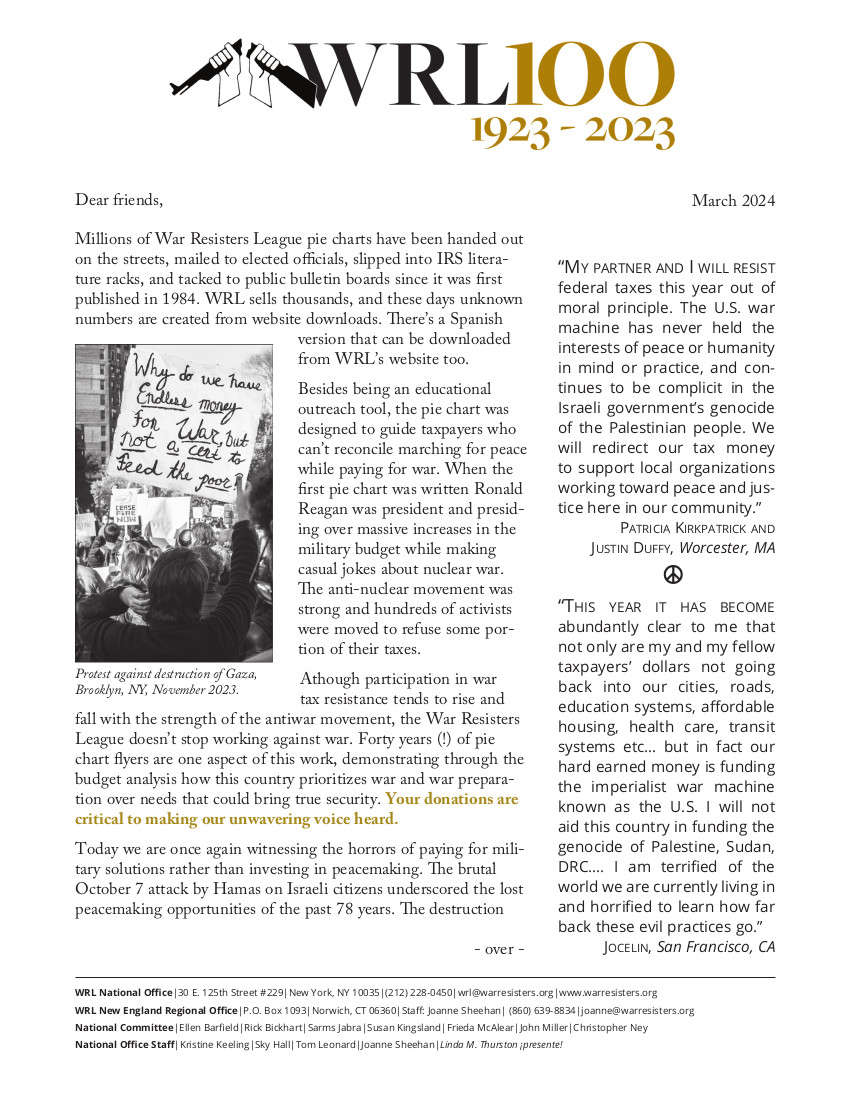
Long before WRL’s first pie chart was issued in 1984, peace groups picketed the IRS every tax day. For example, in 1953 the New York Times reported the “customary band of pickets” — naming WRL, Catholic Worker, and Peacemakers — protested outside the Manhattan office of the IRS on tax day. This year will also include the customary band of pickets and perhaps many more because U.S. tax dollars help to fuel Israel’s destruction of Gaza and its people.
 Tax Day march from the IRS to City Hall, New York, April 18, 2023 (photo by Ed Hedemann)
Ralph DiGia, WRL’s first tax resisting staff member, during 2002 Tax Day demonstration in front of the IRS (photo by Ed Hedemann) 
- Ed Hedemann, longtome war tax resister and former WRL national staff member, wrote WRL's War Tax Resistance book and created the first pie chart flyer for WRL
*“First taxes I paid were 90%. I couldn't believe that. But that was the way it was. 90% is a lot of money to pay to the government for nothing. It was for, you know, for bombers and things.” – Don Everly in PBS documentary “Harmonies from Heaven,” 2016